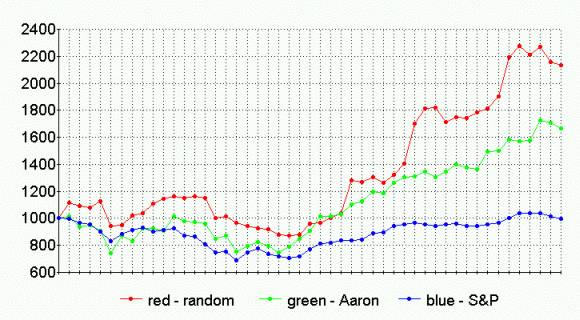
| Value at beginning (May 4, 2001) | ||||||
| Aaron | $1000 | |||||
| randomness | $1000 | |||||
| S&P 500 index (adjusted from 1266.61) | $1000 | |||||
|
|
||||||
|
|
||||||
| Aaron | $1664 | |||||
| randomness | $2132 | |||||
| S&P Index | $996 | |||||
| Randomly selected | Aaron selected | ||||||||||||
| Company | Symbol | Cost | Dividend | Number of Stocks | Price (Apr 29) | Company | Symbol | Cost | Dividend | Number of Stocks | Price (Apr 29) | ||
| Reliant Energy | RRI | 9.91 | 0 | 10 | 10.17 | Valero Energy | VLO | 45.40 | 0.32 | 2 | 68.53 | ||
| Transtech Industries | TRTI.OB | 0.055 | 0 | 1818 | 0.11 | Landec | LNDC | 8.02 | 0 | 12 | 6.40 | ||
| Presstek | PRST | 8.05 | 0 | 12 | 7.45 | Littelfuse | LFUS | 34.16 | 0 | 3 | 26.94 | ||
| Man Sang Holdings | MSHI.OB | 2.55 | 0 | 39 | 6.73 | Emerson Electric | EMR | 62.25 | 1.60 | 2 | 62.67 | ||
| Intevac | IVAC | 7.56 | 0 | 13 | 8.56 | Devon Energy | DVN | 56.00/2 | 0.40 | 2 | 45.17 | ||
| Vital | VTAL | 23.034 | 0 | 4 | 14.37 | Goldcorp (took over WHT) | GG | 2.91 for 34 WHT | 0 | 9 | 12.94 | ||
| Badger Meter, Inc. | BMI | 21.775 | 1.12 | 4 | 33.95 | Massey Energy | MEE | 22.50 | 0.16 | 4 | 36.11 | ||
| Amsurg Corp. | AMSG | 22.70 | 0 | 4 | 25.89 | PPG Ind. | PPG | 54.91 | 1.80 | 2 | 67.55 | ||
| Barrick (took over HM) | ABX | 7.92 for 13 HM | 0.22 | 7 | 22.32 | Eaton | ETN | 60.35 | 1.08 | 2 | 58.65 | ||
| PetroKazakhstan (was Hurricane Hydrocarbon) | PKZ | 13.469 | 0.4449 | 7 | 29.03 | Lufkin Industry | LUFK | 13.61 | 0.72 | 7 | 29.42 | ||
| Sales gains to date | |
| randomness | Aaron |
| +$587.26 | +$296.77 |
| Dividends to date | ||
| randomness | Aaron | S&P |
| $74.80 | $90.13 | $82.47 |